Survey of macroeconomic forecasts - August 2009
Survey of macroeconomic forecasts - August 2009
Since 1996, twice a year the Ministry of Finance has been organizing a survey of forecasts of macroeconomic developments in the Czech Republic, the so-called Colloquium. The Colloquium is set to get an idea on economic experts' views of expected development of the economy and to assess its key tendencies. The Colloquium's outcomes are used mainly to verify feasibility of macroeconomic frameworks of the State Budget and Budgetary Outlook. With transition to electronic form of the Colloquium, it has been decided to open aggregate results to the general public.
27th Colloquium took place at the turn of July and August 2009. Results are based on forecasts of 15 domestic institutions (CERGE-EI, Cyrrus, CNB, Česká spořitelna, ČSOB, ING, Komerční banka, Liberal Institute, MoF, Ministry of Industry and Trade, Ministry of Labour and Social Affairs, Patria, Raiffeisen, Union of the Czech and Moravian Production Cooperatives, UniCredit). To make the survey more representative, forecasts of 3 international institutions, engaged in economic forecasts concerning the CR, were added (European Commission, IMF, OECD).
Respondents expressed their views of the economic developments in 2009 through 2012 where years 2011 and 2012 were regarded as an indicative outlook. Summary of key indicators and comparison with the Czech MoF's Macroeconomic Forecast from July 2009, which has been used to formulate macroeconomic framework of draft 2010 State Budget and Budgetary Outlook for 2011-2012, can be found in Tables 1 and 2.
| 2009 | 2010 | ||||||||
|---|---|---|---|---|---|---|---|---|---|
| min. | consensus | max. | MoF CR | min. | consensus | max. | MoF CR | ||
| Gross domestic product | increase in %, const.pr. | -5,0 | -3,6 | -2,7 | -4,3 | -0,2 | 0,7 | 1,7 | 0,3 |
| Consumption of households | increase in %, const.pr. | -1,2 | 0,7 | 2,0 | 1,1 | -0,8 | 0,7 | 2,5 | 0,7 |
| Consumption of government | increase in %, const.pr. | 0,5 | 2,5 | 5,5 | 1,3 | -1,2 | 1,3 | 4,7 | 0,5 |
| Fixed capital formation | increase in %, const.pr. | -12,5 | -5,7 | -2,5 | -5,7 | -3,5 | -1,1 | 4,0 | -1,5 |
| Inflation rate | per cent | -0,8 | 1,3 | 3,0 | 1,1 | 0,3 | 1,6 | 4,0 | 1,1 |
| GDP deflator | increase in %, const.pr. | 1,6 | 2,6 | 4,5 | 2,8 | 0,1 | 1,3 | 2,5 | 1,0 |
| Employment | increase in per cent | -2,6 | -1,8 | -0,5 | -1,8 | -2,4 | -1,3 | 1,5 | -2,1 |
| Unemployment rate | average in per cent | 5,5 | 6,8 | 7,6 | 6,8 | 5,7 | 7,8 | 9,4 | 8,5 |
| Wage Bill (domestic concept) | increase in %, curr.pr. | -0,9 | 1,4 | 2,8 | 1,0 | 0,3 | 2,3 | 5,0 | 1,0 |
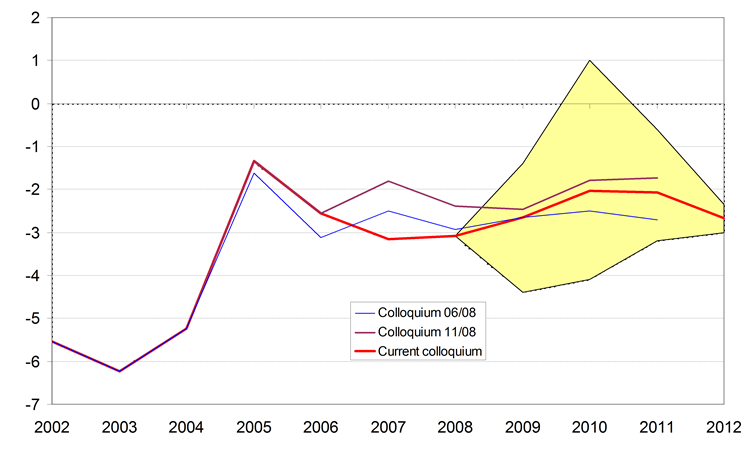
| Current account / GDP | per cent | -4,4 | -2,7 | -1,4 | -2,0 | -4,1 | -2,0 | 1,0 | -0,9 |
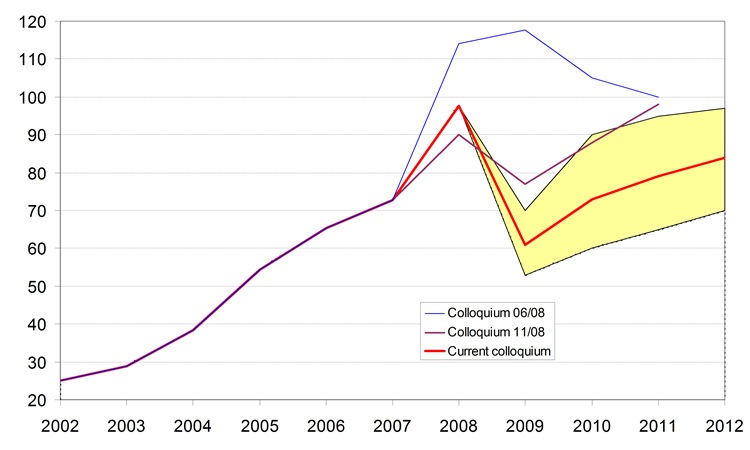
| Crude oil Brent | USD / barrel | 53 | 61 | 70 | 62 | 60 | 73 | 90 | 79 |
| 2011 | 2012 | ||||||||
|---|---|---|---|---|---|---|---|---|---|
| min. | consensus | max. | MoF CR | min. | consensus | max. | MoF CR | ||
| Gross domestic product | increase in %, const.pr. | 1,0 | 2,5 | 3,5 | 2,4 | 2,0 | 3,4 | 5,4 | 3,2 |
| Consumption of households | increase in %, const.pr. | 0,5 | 2,2 | 3,5 | 2,0 | 2,0 | 3,3 | 6,0 | 2,5 |
| Consumption of government | increase in %, const.pr. | -0,5 | 1,5 | 3,8 | 1,1 | 0,5 | 1,7 | 3,9 | 1,1 |
| Fixed capital formation | increase in %, const.pr. | 1,0 | 3,2 | 5,0 | 2,5 | 1,0 | 3,5 | 5,1 | 3,0 |
| Inflation rate | per cent | 1,7 | 2,4 | 5,0 | 2,1 | 2,0 | 2,8 | 5,0 | 2,0 |
| GDP deflator | increase in %, const.pr. | 0,7 | 1,5 | 2,2 | 2,2 | 1,8 | 2,0 | 2,2 | 2,1 |
| Employment | increase in per cent | -0,9 | 0,3 | 1,5 | -0,3 | 0,6 | 1,1 | 2,0 | 1,4 |
| Unemployment rate | average in per cent | 7,0 | 7,9 | 10,1 | 8,1 | 5,0 | 6,7 | 8,0 | 6,9 |
| Wage Bill (domestic concept) | increase in %, curr.pr. | 1,0 | 4,0 | 5,8 | 4,0 | 4,3 | 5,6 | 7,5 | 5,4 |
| Current account / GDP | per cent | -3,2 | -2,1 | -0,6 | -0,6 | -3,0 | -2,7 | -2,4 | -0,6 |
| Crude oil Brent | USD / barrel | 65 | 79 | 95 | 93 | 70 | 84 | 97 | 97 |
Main expected tendencies of macroeconomic developments can be summed up as follows:
-
For 2009, all institutions expect GDP to shrink by more than 2.7 % but not more than 5 % of GDP. In most cases, a slight recovery is anticipated in 2010 while in 2011 and 2012 acceleration of growth should be expected. While in 2009 and 2010 expenditures on final consumption of households and government should become the main stabilizing component in the structure of use, within the horizon of the outlook the economy's dynamics should be pulled again by gross fixed capital formation.
-
Most respondents expect low-inflationary character of the Czech economy to be maintained. Rate of inflation in 2009 and 2010 is anticipated at low levels (1.3 % and 1.6 %, respectively) compared with the extraordinary year 2008. In the following years rate of inflation is mostly expected to shift to values of central bank's new inflationary target or slightly above it.
-
Labour market forecasts reflect GDP developments. Lower predicted economic output thus augurs bigger fall in employment and higher rate of unemployment. Respondents expect decline in rate of employment to continue till 2010, while unemployment should peak in 2011 at the level of 7.9 %.
-
Current forecasts of wage bill (based on the national accounts in current prices) anticipate abrupt slowdown in wage growth from 10.8 % in 2008 to 1.4 % and 2.3 % in 2009 and 2010, respectively. Wage growth dynamics should recover gradually in 2011 and 2012.
-
None of the respondents perceives current account deficit as a risk to maintaining of macroeconomic balance.
List of indicators:
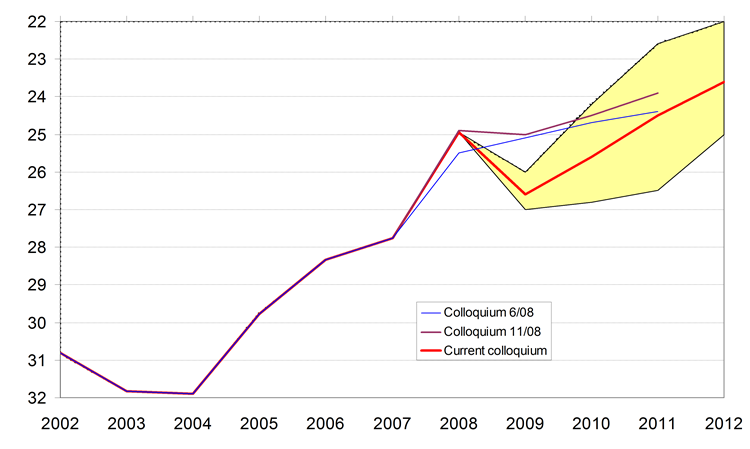
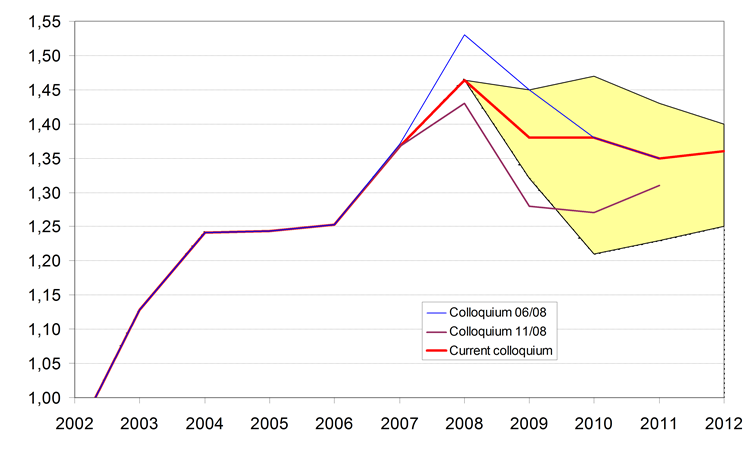
Graphical presentation of past and presumed developments of individual indicators can be seen in graphs 1-16. For the sake of comparison, also consensus forecasts of two previous Colloquiums are included. Extreme forecasts of indicators (min. and max. columns in the tables) constitute limits of the highlighted area.
Graph 1: Exchange Rate CZK/EUR
Graph 2: Exchange Rate USD/EUR
Graph 3: Price of Brent Oil
Graph 4: Long-term Interest Rates
Graph 5: Gross Domestic Product
Graph 6: Household Consumption
Graph 7: Government Consumption
Graph 8: Gross Fixed Capital Formation
Graph 9: GDP Deflator
Graph 10: Consumer Prices
Graph 11: Employment (LFS)
Graph 12: Rate of Unemployment (LFS)
Graph 13: Wage Bill (domestic concept)
Graph 14: Trade Balance
Graph 15: Balance of Income
Graph 16: Current Account of Balance of Payments
Graph 1: CZK/EUR Exchange Rate
Graph 2: USD/EUR Exchange Rate
Graph 3: Price of Brent Oil
USD/barrel
Graph 4: Long-term Interest Rates
% p. a.
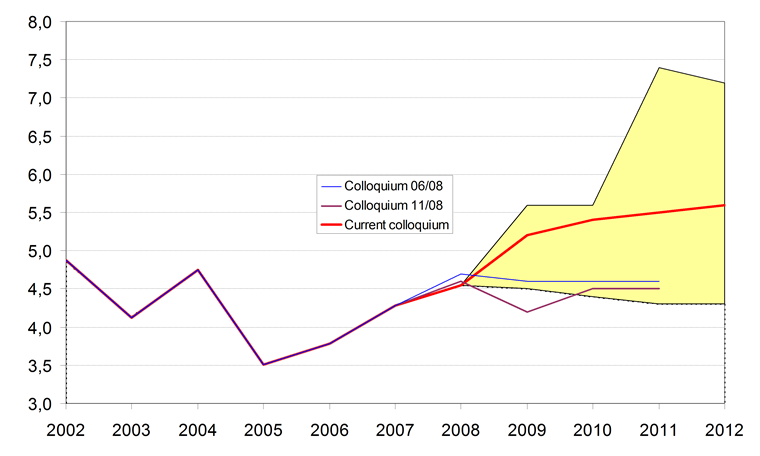
Graph 5: Gross Domestic Product
real growth in %
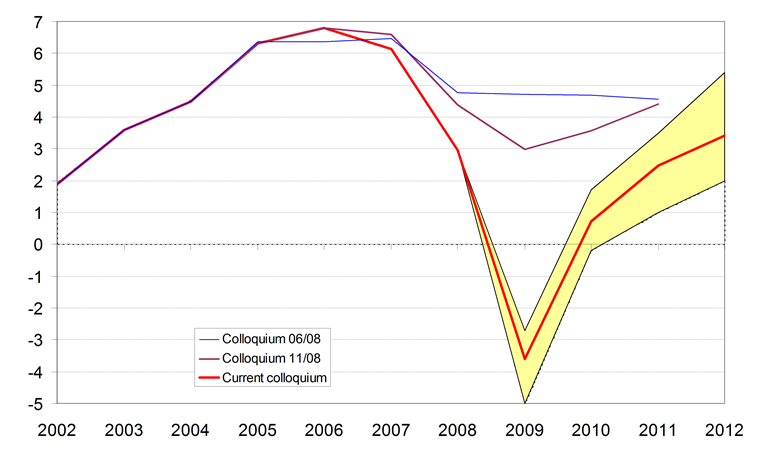
Graph 6: Household Consumption
real growth in %
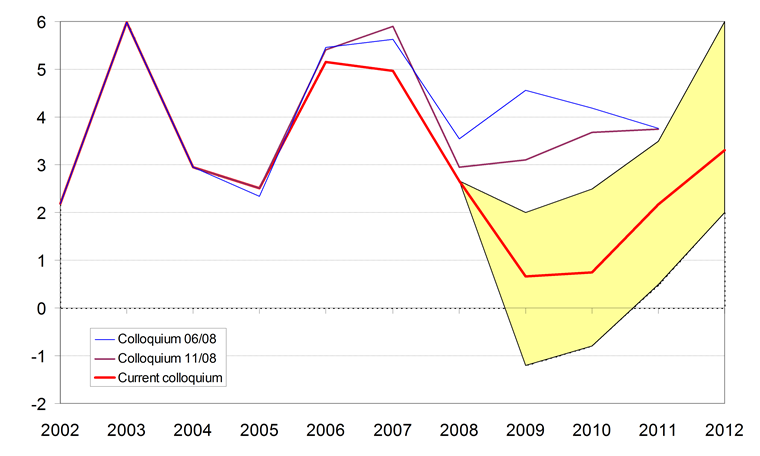
Graph 7: Government Consumption
real growth in %
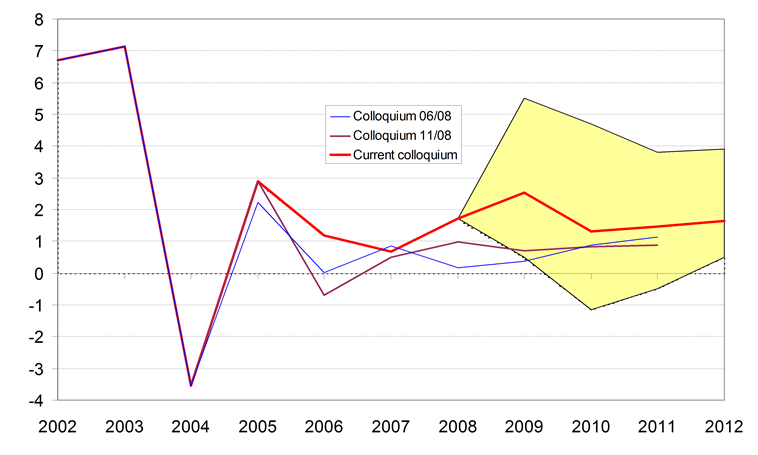
Graph 8: Gross Fixed Capital Formation
real growth in %
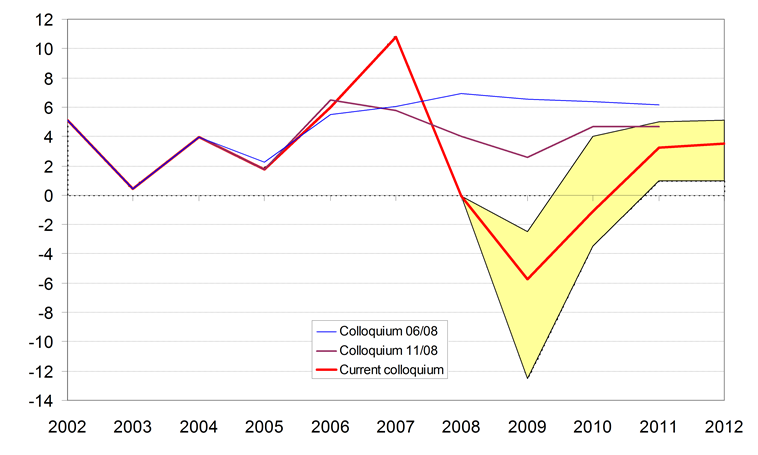
Graph 9: GDP Deflator
growth in v %
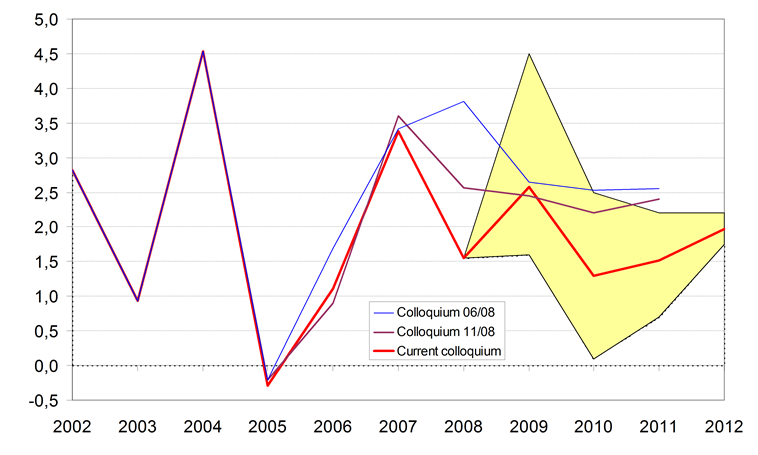
Graph 10: Consumer Prices
average rate of inflation in %
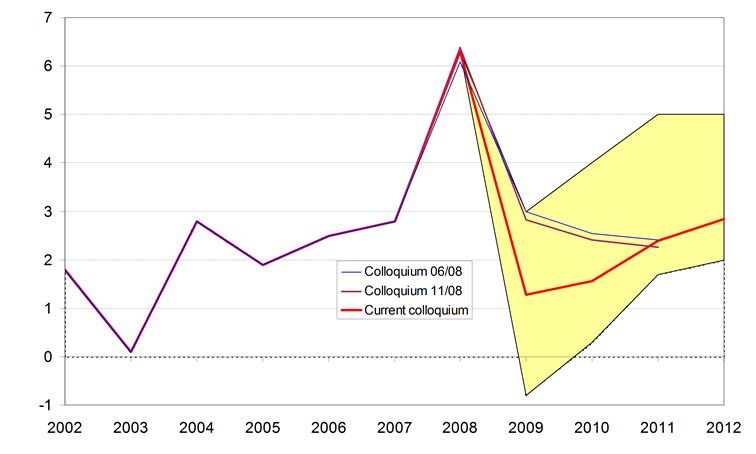
Graph 11: Employment (LFS)
growth in %
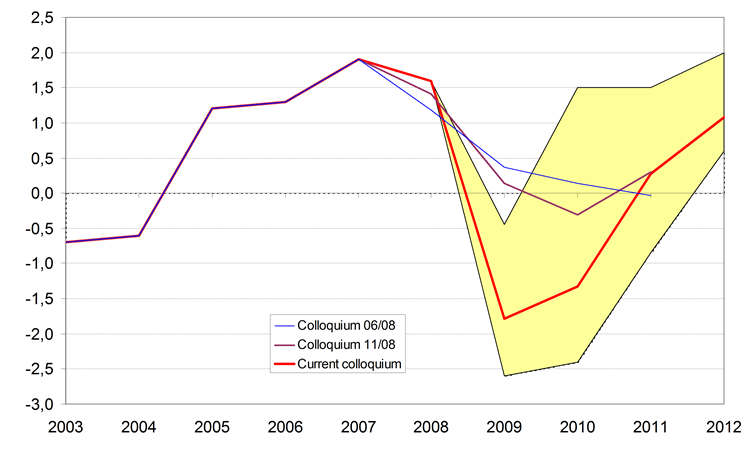
Graph 12: Rate of Unemployment (LFS)
in %
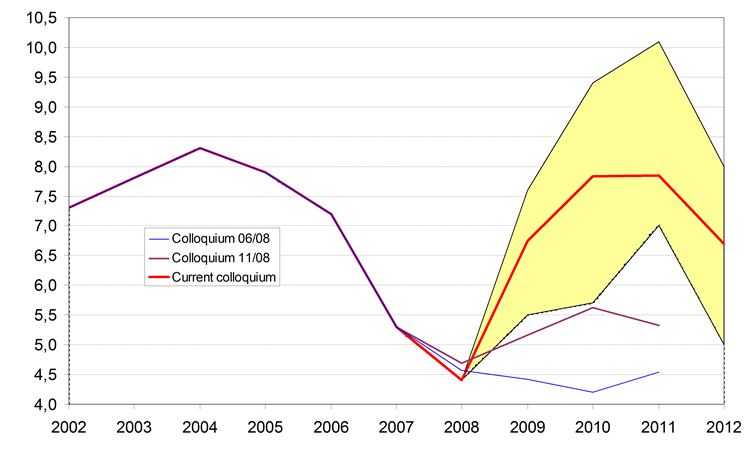
Graph 13: Wage Bill (domestic concept)
nominal growth in %
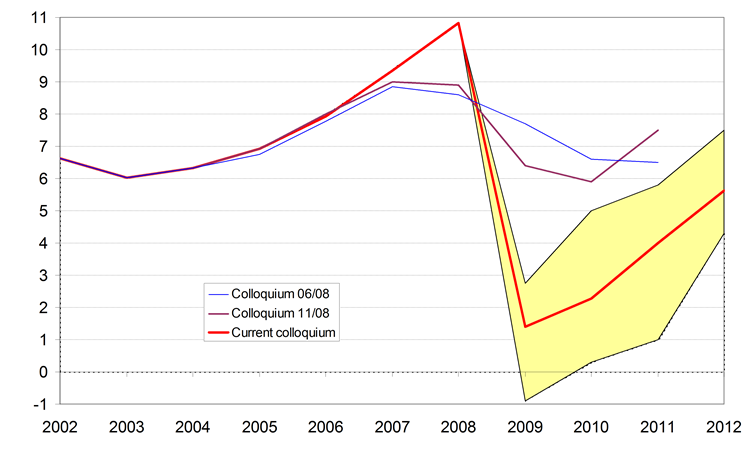
Graph 14: Trade Balance
fob-fob - BoP definitions, CZK bn
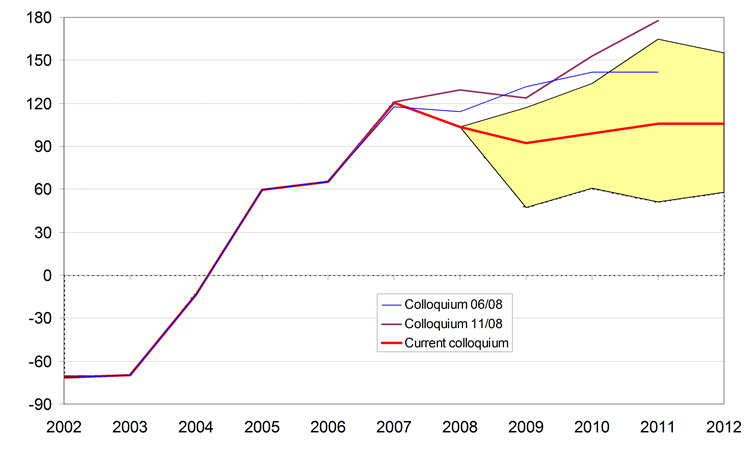
Graph 15: Balance of Income
CZK bn
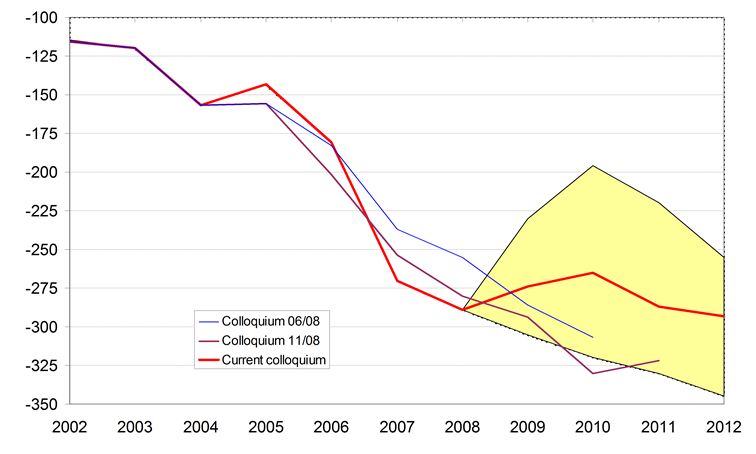
Graph 16: Current Account of Balance of Payments
in % of GDP
